Proposal
Content
Project Summary
- Summary: This project aims to build an automated data processing system (Data Analytics Pipeline) on the Amazon Web Services (AWS) cloud platform. The system is designed with an event-driven and serverless architecture, specialized for processing, cleaning, and analyzing large-scale taxi trip record datasets (TLC Trip Record Data - Yellow Taxi). The ultimate goal is to transform raw data into high-value insights that support business decision-making through interactive dashboards.
- Objectives:
- Fully automate the data collection and processing workflow (ETL) from source to Data Warehouse.
- Ensure data quality through automatic error detection and removal of noisy data such as outliers and missing values before analysis.
- Provide a flexible analytics platform that supports both fast ad-hoc queries and in-depth OLAP analysis.
- Visualize business data such as trip demand, revenue, and spatial distribution for leadership teams.
- Scope:
- Build a Data Lake (Raw & Processed Layers) on Amazon S3.
- Implement an automated ETL pipeline using AWS Step Functions, Lambda, and Glue DataBrew.
- Integrate Amazon Redshift as the data warehouse and Amazon Athena as the query layer.
- Build a BI reporting system on Amazon QuickSight.
- Set up security, monitoring, and alerting systems using CloudWatch, CloudTrail, and SNS.
Problem Statement
Current Challenges: The Yellow Taxi dataset from the New York City Taxi and Limousine Commission contains a massive amount of information, but the raw data also includes a significant amount of noise and anomalies:
- Poor data quality: There are trips with no passengers (
passenger_count = null), zero distance (trip_distance = 0), or negative fares (fare_amount < 0). - Lack of automation: Manual processing or legacy systems are time-consuming, error-prone, and unable to scale as data volume grows monthly with new Parquet/CSV files.
- Fragmented information: Data is not centralized into a single source of truth, making revenue reporting and customer behavior analysis difficult and slow.
Technical Solution: Deploy a modern Data Lakehouse architecture on AWS:
- Automatic triggering (event-driven): Use Amazon EventBridge to automatically capture events whenever new data files are uploaded, eliminating manual steps.
- Strict quality control: Use AWS Glue DataBrew for profiling and AWS Lambda for branching logic. For example, automatically send an alert if the data error rate is greater than 20%; otherwise continue the pipeline.
- Standardization and optimization: Clean the data, create additional meaningful features such as
trip_durationandtrip_speed, and store it in columnar Parquet format with partitioning to optimize cost and query performance.
Solution Architecture
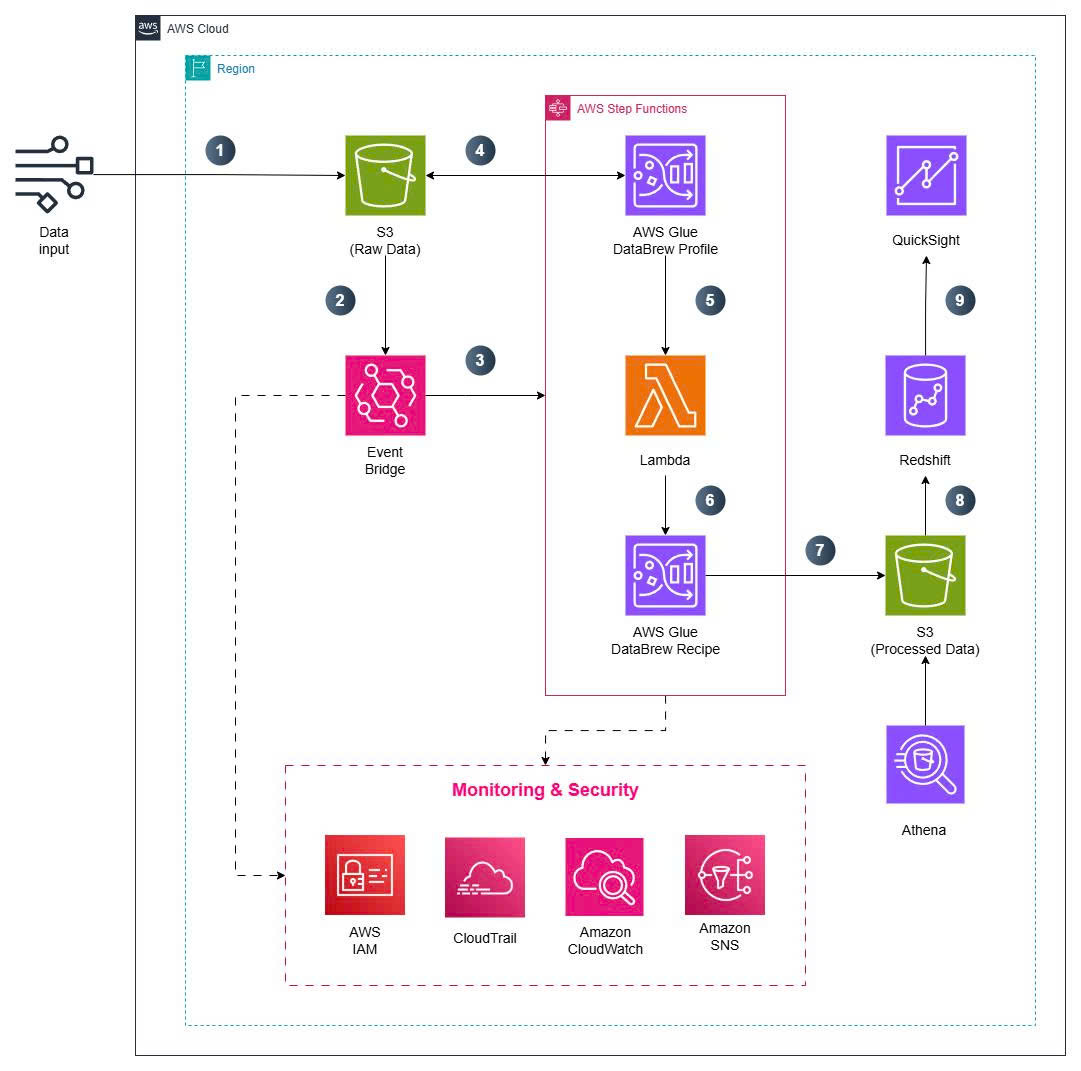
The system architecture follows this processing flow: Raw → Processing → Analytics → Visualization.
Technical Architecture (Workflow Overview)
- Ingestion: Raw data (Parquet/CSV) is uploaded to the S3 Raw Bucket in the Data Lake.
- Trigger: An
ObjectCreatedevent from S3 triggers EventBridge. - Orchestration: EventBridge invokes Step Functions to orchestrate the entire pipeline lifecycle, including retries and logging.
- Profiling: Glue DataBrew analyzes the dataset to identify anomalies such as missing values, outliers, and mismatches.
- Validation: Lambda reads the profiling results to determine the next step or send an error alert.
- Transformation: A Glue DataBrew recipe executes ETL tasks including data cleaning, type standardization, and feature engineering.
- Processed Storage: Cleaned data is stored in the S3 Processed Bucket in Parquet format, partitioned by Year/Month/Day.
- Data Warehousing: The
COPYcommand loads data from S3 into thefact_taxi_triptable in Amazon Redshift for OLAP workloads. In parallel, Amazon Athena supports ad-hoc querying directly on S3. - Visualization: Amazon QuickSight connects to Redshift and Athena to display dashboards such as Trip Demand, Revenue, and Spatial Analysis.
Technology Stack:
| Layer | AWS Services | Purpose / Role |
|---|---|---|
| Storage / Data Lake | Amazon S3 | Stores raw data and curated/processed data. |
| Event & Orchestration | EventBridge, Step Functions | Automatically triggers and orchestrates the workflow. |
| Compute / Logic | AWS Lambda | Handles orchestration and validation logic. |
| Data Processing (ETL) | AWS Glue DataBrew | Profiles, cleans, and transforms data with no-code ETL. |
| Data Warehouse | Amazon Redshift | Centralized OLAP data warehouse storing fact and dimension tables. |
| Ad-hoc Query | Amazon Athena | Executes SQL queries directly without loading into the warehouse. |
| BI / Visualization | Amazon QuickSight | Builds management reporting dashboards. |
| Security & Monitoring | IAM, CloudTrail, CloudWatch, SNS | Handles access control, audit logs, monitoring, and alerts. |
Implementation Plan
Roadmap and Milestones (Estimated 4 weeks)
- Phase 1: Foundation & Data Ingestion (Weeks 1)
- Set up the AWS environment and configure IAM roles and security.
- Create S3 buckets for raw and processed data.
- Configure an EventBridge trigger for S3
ObjectCreatedevents.
- Phase 2: Orchestration & Data Processing (Weeks 2)
- Create Glue DataBrew profiles to analyze the schema structure of the taxi data.
- Write DataBrew recipes for ETL tasks such as removing nulls, filtering negative values, and creating
trip_durationandtrip_speedfeatures. - Develop AWS Lambda functions to read rules and handle branching logic.
- Package the workflow into AWS Step Functions.
- Phase 3: Data Warehousing & Querying (Week 3)
- Set up an Amazon Redshift cluster and create the
fact_taxi_tripschema. - Build an automated flow to
COPYprocessed data from S3 into Redshift. - Configure Amazon Athena to point to the S3 Processed bucket.
- Set up an Amazon Redshift cluster and create the
- Phase 4: BI Visualization & Handover (Weeks 4)
- Develop QuickSight dashboards for Trip Demand, Revenue per Vendor, and Heatmaps.
- Set up CloudWatch alarms and SNS notifications to alert via email or Slack when ETL fails.
- Perform end-to-end UAT testing and hand over the system documentation.
Cost Estimation Model
The system maximizes the use of serverless architecture, so costs follow a pay-as-you-go model. To optimze the cost,
we will put region in us-east-2 and Redshift will only used in 1 hour.
The estimated monthly cost breakdown is as follows:
| AWS services | Cost / Week |
|---|---|
| Amazon S3 | $1.50 |
| EventBridge, Step Functions | $0.15 |
| AWS Lambda | $0.00 (Free Tier) |
| AWS Glue DataBrew | $7.50 |
| Amazon Redshift | $11.00 |
| Amazon Athena | $0.50 |
| Amazon QuickSight | $8.00 |
| IAM, CloudTrail, CloudWatch, SNS | $1.00 |
| Total | $29.65 |